UNU’s World Flood Mapping Tool is One of 2021’s 100 Greatest Innovations Honoured with the “Best of What’s New Award,” Security Category
Free online tool maps floods since 1985 to street level; Will aid disaster planning, especially in Global South, help plan urban and agricultural development, effective flood defences, disaster readiness, identify supply chain vulnerabilities
Popular Science today named UN University’s new online tool that generates instant, accurate street-level maps of floods worldwide since 1985 as one of the 100 greatest innovations of 2021.
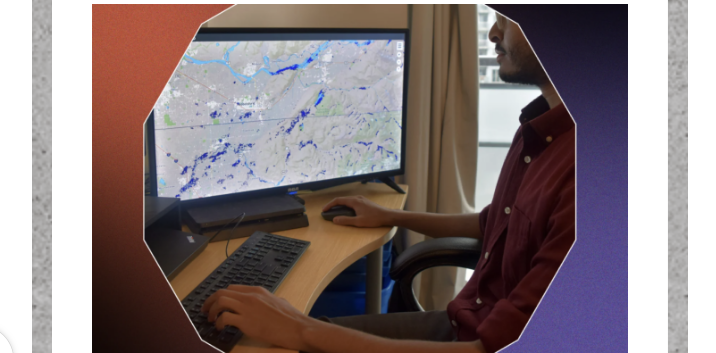
The free online World Flood Mapping Tool (at floodmapping.inweh.unu.edu) was created by UNU’s Institute for Water, Environment and Health in Hamilton, Canada, to help inform disaster mitigation and other planning in all countries, especially those in the Global South where flood risk maps are rare and often badly out of date.
Now in its 150th year, Popular Science has reviewed annually since 1988 thousands of products “in search of the top 100 tech innovations of each year—breakthrough products and technologies that represent a significant advancement in their categories,” according to its website.
Best of What’s New Awards are presented to 100 products and technologies in 10 categories: Aerospace, Automotive, Engineering, Entertainment, Gadgets, Health, Home, Personal Care, Security, and Sports & Outdoors.
The UNU-INWEH global flood mapping tool is honoured in the security category.
Says Popular Science Editor-in-Chief Corinne Iozzio: “The Best of What’s New Awards celebrates the year’s greatest feats of human ingenuity—the steps towards safer, healthier, more-sustainable, and happier days ahead. Despite the supply chain challenges making headlines in 2021, breakthroughs across all our categories have helped us glimpse a future brimming with possibilities.”
The publication’s Best of What’s New Awards are judged on “the significance of the innovation, the quality of the design and the finished product, the originality of the product, and the ambition and scope of the project.”
“To pick the winners, Popular Science editors vet thousands of candidates—ranging from feats of engineering to hyper-intelligent software—searching for objects and endeavors that not only promise to improve life on this planet (and beyond!), but also deliver on that promise.” The innovations chosen represent “a definitive list of up to 100 of the most incredible and innovative technologies and products from the past year.”
Says UNU-INWEH Director Vladimir Smakhtin: “Created with support from Google, MapBox and other partners, UNU-INWEH’s world flood mapping tool lets users adjust variables to help locate gaps in flood defences and responses, and to plan future development of all kinds — for example, where to build or upgrade infrastructure, or develop agriculture.”
“We are proud of this recognition from Popular Science and appreciate the additional attention that the award will generate for the flood mapping tool. The greatest reward will be its use to improve disaster mitigation and other planning, especially in the Global South.”
“We need to prepare now for more intense and more frequent floods due to climate change and hope this tool will help developing nations in particular to see and mitigate the risks more clearly.”
How to use the tool
Simple to use, UNU-INWEH’s world flood mapping tool requires only Internet access to obtain a flood map at 30-meter resolution — street by street level. An upcoming version for more commercial uses, for example by insurance firms, will offer even more precise building-level resolution.
Tool Description
The tool allows users to adjust variables to help locate gaps in flood defences and responses, and to plan future development of all kinds — for example, where to build or upgrade infrastructure, or develop agriculture.
Floods in the past decade have impacted the lives of more than half a billion people, mainly in low and middle income countries, and resulted in damages of nearly US $500 billion — roughly equal to the GDP of Singapore. More recent floods worldwide have added to a fast growing toll of upended lives, damage and deaths.
Hamid Mehmood, a GIS and remote sensing specialist at UNU-INWEH who led the tool’s development, notes that an estimated 1.5 billion people — greater than the population of Europe — live at risk of exposure to intense flooding.
A UNU-INWEH survey showed a majority of flood forecasting centers in flood-prone countries lack the ability to run complex flood forecasting models.
Dr. Mehmood adds that floods like those this year in Europe that killed more than 200 people and caused billions of dollars in damages are now up to nine times more likely because of climate change.
“As temperatures continue to rise the number of flood events will increase along with their severity,” he said. “No place is immune. And yet remarkably few regions, even in wealthy countries, have useful, up-to-date flood maps because of the cost and difficulty of creating them.”
The World Flood Mapping Tool uses the Google Earth Engine combined with decades of Landsat data since 1985 — a vast catalog of geospatial data enabling planet-scale analysis capabilities.
Layers of Landsat information for a selected region and specified timeframe identifies temporary and permanent water bodies while integrating site-specific elevation and land-use data.
This produces a detailed map of flood inundation in recent decades, with available overlays of population, buildings and land use, which can be used for community planning, building zoning, insurance assessments and more.
To validate the technology, maps generated in less than a minute using the new tool were compared to documented flooding events in Australia, Bangladesh, Canada, Cambodia, India, Mozambique, Sri Lanka and Thailand (detailed below), with 82% accuracy achieved.
Wikipedia’s list of history’s deadliest floods (here) shows 211 events, 103 of which occurred from 1985, the first year covered by the new tool’s data.
The new tool will also reflect new floods soon after they occur to provide the most up-to-date maps to help assess overall flood impacts and plan for the future.
“Painting a detailed picture of the historical and potential flood risk areas will be invaluable for any urban and regional planning department,” says project collaborator Dr. Duminda Perera of UNU-INWEH.
The more detailed version of the tool in development for commercial use will provide resolution at a building-by-building level and incorporate building occupancy data.
And a free flood risk prediction tool for release next year will use artificial intelligence to generate current and future flood risk maps for three climate change scenarios at the city, district, and river basin levels.
Maximizing the effectiveness of investments in public infrastructure and reducing costs
Reliable up-to-date information about areas at risk of flooding is especially valuable in Africa and Southeast Asia, where urban areas are expected to grow 80% by 2030. The tool can show the flood-safe locations for housing and industry as well as improving overall urban planning.
The new World Flood Mapping Tool enables governments, funding agencies, and disaster management authorities to hone in on the highest potential risk locations of flooding in the future. Knowing exactly where flooding will occur can maximize the effectiveness of investments in public infrastructure and reduce costs.
It differs from previously available systems in a number of ways, including:
Improved resolution of inundation maps to 30 meter resolution, enabling analysis at a citywide level
Focus on the Global South, where data and information gaps are prominent and annual losses due to floods are high
Improved accuracy of inundation maps using data from multiple satellite sensors
Improved accuracy and shorter development time of flood risk maps by using AI models
Dr. Mehmood adds that natural disaster-related insurance rates (where such insurance exists for homes and livelihoods impacted by flooding), flood-related human and economic losses, etc., can be estimated using the new tool.
Potential supply chain vulnerabilities can be revealed. And during disasters, the tool can be used to help determine emergency relief routes.
The World Flood Mapping Tool could also potentially guide development of agriculture insurance support for persons living and farming at the subsistence level. Creating this safety net would have far-reaching implications for global development goals and promoting more secure economies and nations.
The flood inundation maps generated by the tool can be merged with other open datasets — population density or land use / land cover changes, for example — enabling a variety of ways to peer into the future.
Adding other remote-sensing datasets will also improve the tool and offer new ways to employ it, all of which strengthens the ability of countries in the Global South and elsewhere to better plan for and respond to disasters.
Partners
UN:
UNESCO Madanjeet Singh Centre for South Asia Water Management, Sri Lanka
Government:
Directorate of Planning, Bangladesh
Private Sector:
Google, in-kind support under their their Google Cloud for Researchers program
MapBox, in-kind support under their Education program
Civil Society:
Asian Disaster Preparedness Center, Thailand
Network of Disaster Management Practitioners, Pakistan
Water Resources Research and Development Centre, Nepal
Academia:
McMaster University, Canada
International Institute of Information Technology, India
The following case studies were used to validate the accuracy of the new flood mapping tool:
Australia, Queensland, 11 – 18 February, 2008
Severe weather and intense rain hit the central coast of Queensland, where some rainfall stations received over 600 mm of rain in just six hours. Insurance companies paid out roughly US $297 million, and road and drainage infrastructure repairs cost an estimated US $32 million.
Bangladesh, Dhaka, 2017
Three major flood events affected over 8 million people and caused loss of life, severe damage to housing, infrastructure, and affected crops and livestock throughout the country. The flood event studied resulted from heavy rains from late March to early April, with a focus on the country’s northeastern region, where over 850,000 households were impacted, and 220,000 acres of ready-to-harvest rice were damaged.
Cambodia, Phnom Penh, 2011
Flooding affected 18 of 24 provinces in 2011, damaged infrastructure and agriculture, jeopardized food security, and directly impacted over 1.2 million people.
Canada, Red River, April 2019
The Red River, which originates from Minnesota and North Dakota and flows northwards through Manitoba to Hudson Bay, flooded extensively in 1950 and 2011. The study area focused on the agricultural land and small communities between Winnipeg and the US border flooded in April 2019.
India, Bihar, April 2017
Floods caused by excess rainfall during the monsoon season in April 2017 affected 19 districts of North Bihar, caused 500 deaths and impacted around 17 million people
Mozambique / Malawi, March 2015
Near Mozambique’s border with Malawi, a flood in March 2015 occurred shortly after two tropical cyclones hit. Over 530,000 people were affected, about 30,000 displaced and 37 died. Cascading post-disaster events included an outbreak of cholera that ravaged the already badly-affected communities
Sri Lanka, Colombo, May 2016
A tropical storm in May 2016 impacted 22 of 25 districts in the country and caused widespread flooding and landslide devastation. Over 300,000 people were affected, with 203 listed as dead or missing
Thailand, Pathumthani and Bangkok, 2011
In 2011 Thailand recorded record high rainfall during the monsoon season, immediately followed by four tropical storms in the north. River banks burst and releases of water from upstream dams exacerbated flooding that persisted for over 150 days. The floods inundated over 30,000 square km and caused roughly US $900 million in losses (US $360 in insured losses).
* * * * *
The UNU Institute for Water, Environment and Health
Marking its 25th anniversary in 2021, UNU-INWEH is supported by the Government of Canada through Global Affairs Canada and hosted by McMaster University.
inweh.unu.edu
* * * * *
United Nations University
The United Nations University (UNU) is a global think tank and postgraduate teaching organisation headquartered in Japan. The mission of the UN University is to contribute, through collaborative research and education, to efforts to resolve the pressing global problems of human survival, development and welfare that are the concern of the United Nations, its Peoples and Member States.
In carrying out this mission, the UN University works with leading universities and research institutes in UN Member States, functioning as a bridge between the international academic community and the United Nations system.
Through postgraduate teaching activities, UNU contributes to capacity building, particularly in developing countries.


